
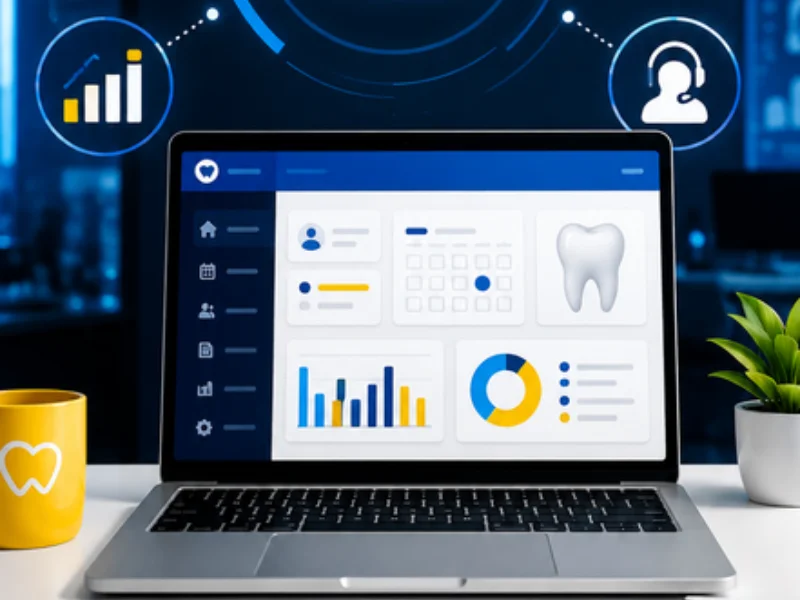
A dental management dashboard is worth having when it helps you make a decision, not when it just shows charts. Pick the decision first (schedule, treatment plans, production or finances), read the KPI that gives evidence for it and finish with an action that has an owner and a date to check the result.
Monday, 8 a.m. The schedule looks full, the number of treatment plans "under consideration" has gone up and this month's revenue still isn't keeping pace with how busy the clinic feels. Which of these signals deserves attention first?
ProDent's Management KPIs help answer that question because they bring different views of the operation into one place. The clinic can follow financial trends, payments made, treatment plan status, production by provider and specialty, average, minimum and maximum values, appointments by status and future bookings.
The practical gain comes when the manager connects a number to its context, forms a hypothesis and assigns an action to someone. A KPI shows where to look. The decision comes from combining the right period, a fair comparison, what's happening in the clinic and an action you can verify.
Start with the decision, not the dashboard
Opening every KPI without a question usually produces information overload. A better approach starts with the decision management needs to make right now.
Instead of asking only "how are the numbers?", try framing an operational question:
- Do we need to shift hours between providers or specialties?
- Which treatment plans need follow-up first?
- Does recorded production match how full the schedule is?
- Do this period's collections and payments support our next decision?
Once the question is clear, the dashboard stops being a collection of numbers and becomes an investigation tool.
Decision 1: Where to adjust the schedule before the month ends
The scheduling KPIs show the number and percentage of appointments by status in the selected period. They also show appointments booked now for future dates. Together, these help you separate apparent activity from capacity that's actually being used.
Imagine a provider with a full book but also a cluster of no-shows and reschedules. The answer isn't necessarily to open more slots. First, the clinic can look at appointment confirmations, how same-day add-ons are distributed, how far ahead patients book and whether the front desk needs to follow up.
How to turn the signal into action
- Set the period. Compare the current month with an equivalent period, and don't mix full weeks with weeks still in progress.
- Read the statuses. Look at completed visits, no-shows, reschedules and future appointments, based on the records available.
- Find the concentration. Check whether the problem shows up for one provider, specialty, shift or booking pattern.
- Choose an intervention. Adjust confirmations, schedule distribution, follow-up or availability, then watch whether behavior changes.
Possible decision: Redistribute idle slots and strengthen the confirmation routine for one specific shift, then review the results over the same time window.
Decision 2: Which treatment plans need follow-up
The dashboard groups treatment plans by status, such as accepted, declined and under consideration. The reading is more useful when each status leads to a different priority instead of the same approach for everyone.
A rise in plans under consideration may point to interest that's still active, slow follow-up, questions about the treatment or no next step on record. A rise in declined plans calls for a different investigation: the type of cases, how clearly the plan was presented, response time or the reason the patient gave.
Three questions for the manager
- Which period, provider or type of visit did the increase in plans under consideration come from?
- Do these patients have an owner, a deadline and a next contact on record?
- Can the team tell a recoverable opportunity from a case that's closed?
Here the KPI connects directly to your CRM and follow-up routine. The dashboard shows where acceptance is stalling, while the follow-up process organizes who gets contacted, when and with what context.
Possible decision: Prioritize the oldest plans under consideration, assign an owner and record a next step, without sending the same generic message to everyone.
Decision 3: How to read production without a simplistic ranking
Production by provider and specialty shows where the clinic concentrates visits and revenue. The dashboard can also show average, highest and lowest values within each category.
These numbers shouldn't be used alone to decide who is "better" or "worse." Specialties have different visit lengths, complexity, costs, schedules and clinical stages. A number only means something when compared under equivalent conditions and against the goal for that area.
Lower production may signal idle time, low demand, longer treatments, missing records or a change in procedure mix. Higher production may reflect demand, good utilization or too much concentration. Either way, the KPI opens an investigation. It doesn't close the diagnosis.
What to cross-check
- Recorded production and schedule utilization
- Specialty, chair time and treatment profile
- Average value and procedure mix
- Current period and a comparable past period
- What the system shows and what the team actually sees
Possible decision: Review how one specialty's schedule is distributed and confirm the records are complete before changing targets, hours or training.
Decision 4: Which financial movement needs a response
Financial trends and payments made help you see money coming in and going out over the period. When that reading is connected to treatment plans, production and the schedule, the clinic gets a clearer view of what's generating activity and what's actually reaching the bank account.
If visits grow but collections don't keep up, management can look at payment terms, payment methods, overdue balances or unposted entries. If payments go up without a similar change in operations, review what's driving expenses. If the average value changes, find out whether the mix of specialties or procedures shifted.
The key is not to treat production, treatment plans, collections and profit as the same thing. Each answers a different question. The dashboard brings them closer together, but the quality of the decision depends on complete records and a consistent reading of the period.
A safer reading sequence
- Spot the change. Identify what moved compared with a comparable period.
- Find the source. Connect the change to the schedule, treatment plans, production, collections or payments.
- Check the records. Make sure the data was entered completely before deciding.
- Pick a response. Define the action, the owner and when you'll check the effect.
Possible decision: Review the gap between production and collections for the period, clear pending entries and adjust the billing routine before planning new spending.
A KPI is only as reliable as your data entry routine
The dashboard depends on what the team records. Appointments without an updated status, treatment plans with no outcome, incomplete payments or procedures that were never posted can all distort the picture.
So before setting targets or holding people accountable, agree on simple data entry rules. Who updates appointment status? When does a treatment plan move to the next stage? Who checks collections and payments? How long does the team have to fix an incomplete record?
That discipline cuts rework and builds trust in the dashboard. It also makes support more productive, because the team can bring a specific question, a defined period and a pattern they've already spotted.
Pro365 AI, consultants and support behind the decision
Pro365 AI has two roles here. The Instructor helps users learn how to do tasks in the system, and the Consultant helps answer questions about the clinic's own data.
These tools can shorten the path from question to answer. Still, decisions about the schedule, targets, staffing and investment need human context. Hands-on support and personalized consulting help review setup, training, data quality and how the features apply to each clinic.
The most useful combination is simple: organized data, clear questions, technology to support the reading and people who own the decision.
From signal to next action, one decision at a time
A clinic doesn't need to watch every number with the same intensity. It needs to know which decision is at stake, which KPI offers evidence and which action can be tested.
Start with one of the four conversations in this article: schedule, treatment plans, production or finances. Open the right period on the dashboard, find a meaningful change and record the next action with an owner. Then come back to the same time window to check the effect.
If your team isn't confident using the dashboard yet, HartSystem can help with setup, training and reading the data. With Pro365 GO, the new ProDent that runs 100% on the web, your schedule, treatment plans, production and finances feed the same KPIs. Book a demo to see how the dashboard connects to your clinic's daily work.