
Dental chair productivity is best measured across a complete treatment cycle, not per appointment or per hour on the schedule. It shows how much contribution margin a cycle generates for each chair hour it actually uses, alongside how much of that value has been collected and whether quality held up.
A schedule can look great and still hide a bad decision. A treatment was sold at an attractive fee, took several appointments, needed a lab, used materials, required an extra visit and ended with a good part of the balance still unpaid. If you only look at production or value per visit, you see performance. If you rebuild the cycle, you may see pressure on working capital and a chair that contributed less than you thought.
That's the difference between measuring activity and understanding the economics. Chair productivity isn't about charging more per minute, speeding up care or turning clinical decisions into a spreadsheet. It's about understanding how net revenue, variable costs, the capacity actually used and collections relate over a treatment, while protecting quality, safety and the patient experience.
Looking at the chair in isolation can mislead you
Robert Kaplan and Michael Porter argue that healthcare costs should be measured over the full cycle of care, based on the real use of resources such as time, people, facilities, equipment and supplies. For a dental clinic, the takeaway is direct: a multi-visit treatment can't be judged only by its highest-value procedure or by a monthly chair average.
The American Dental Association also separates production, adjusted production, collections, expenses and overhead. Its most useful warning is that high production doesn't mean much without strong collections, and that fixed and variable costs need to be understood before you decide on expansion or new investments.
In practice, three distortions show up when a clinic only measures revenue per scheduled hour:
- The treatment looks profitable because lab costs, associate splits, card fees and case-specific materials were left out.
- The time looks efficient because setup, room turnover, add-ons, necessary follow-ups and extra visits weren't counted as part of the cycle.
- The result looks realized because production was posted, even though part of the balance is still on a payment plan, overdue or at risk of not being paid.
My view is simple: the chair shouldn't be treated as a machine that has to run with no slack. It's shared clinical capacity, tied to providers, assistants, materials, sterilization, documentation and enough time for the patient. The goal is to allocate that capacity wisely, not to squeeze out speed at any cost.
The right unit is the treatment cycle
Before you calculate any metric, define where the cycle you'll analyze starts and ends. It could run from treatment plan acceptance to final payment, from the first visit to the planned completion or another cut that makes sense for that line of care. What matters is using the same definition every time you compare cases.
Time-Driven Activity-Based Costing, developed by Kaplan and Anderson, works with two core parameters: the cost of supplying capacity and the time the work consumes. In healthcare, the approach maps the patient's path and the resources used at each step. For a clinic, that means starting with useful estimates you can revise, not a perfect costing project that never gets finished.
Three numbers, three different questions
Cycle contribution margin = net revenue recognized minus the variable costs and expenses directly tied to the cycle.
Before comparing service lines, check with your accountant which items really vary with the treatment and which belong to your fixed structure.
Chair productivity = cycle contribution margin divided by the chair hours the cycle actually used.
This tells you how much the clinical capacity contributed to covering fixed costs and building profit. It isn't net profit, it doesn't measure quality and it doesn't justify cutting clinical time. Use it to compare similar workflows and investigate differences.
Cycle cash realization = amount collected in the period divided by the amount due in the same period.
This third number keeps you from treating a treatment on a payment plan as cash in hand. A service line can have a healthy margin and still tie up working capital, because lab bills and materials are paid before the patient finishes paying.
A hypothetical case, without false precision
Picture a cycle with 4,800 in net revenue, 2,250 in variable costs and expenses, and seven chair hours spread across several visits (illustrative amounts, no currency). The cycle contribution margin would be 2,550, and chair productivity would be roughly 364 per chair hour used.
On its own, that number doesn't tell you whether performance is good. It becomes meaningful when you compare it with similar cycles, practical capacity, payment timing, clinical standards, case complexity and your own clinic's history. It also needs to be checked by your accountant, because how taxes, splits, materials and labor are classified depends on your setup and contracts.
Now suppose two extra hours were needed. The worst conclusion would be to blame the team or automatically tighten the next appointments. The right investigation asks:
- Were the extra hours clinically necessary, or did they come from an avoidable failure?
- Did the treatment plan and the scheduled time reflect the complexity known at the start?
- Was there waiting for materials, the lab, a room, information or an approval?
- Did the documentation allow continuity without rebuilding context?
- Did the payment terms create a real gap between what you paid out and what came in?
The answer drives the decision. A clinical need changes how you plan the next case. Avoidable waiting calls for a process fix. Higher-than-expected variable costs call for a review of purchasing, contracts or fees. A cash gap calls for different terms, a reserve or a negotiation. The same metric can lead to completely different actions.
The minimum dashboard for a responsible decision
The Institute for Healthcare Improvement recommends combining outcome, process and balancing measures. Balancing measures check whether a change that improves one part of the system creates problems somewhere else. For a clinic, that means tracking a few connected signals over time and collecting just enough data to learn, without turning data collection into a new kind of waste.
| Layer | Working metric | Decision it supports |
|---|---|---|
| Outcome | Contribution margin per cycle and per chair hour | Compare economic variation between similar cycles |
| Process | Planned vs. actual hours, extra visits, waiting between steps | Find where the cycle uses more capacity than planned |
| Cash | Amount due, collected and overdue in the cycle | Assess working capital and payment terms |
| Balance | Avoidable rework, delays, team workload, continuity and patient experience | Prevent financial gains that shift cost or risk elsewhere |
This dashboard doesn't have to be built into your software to be useful. You can put it together from the data you already have, as long as your definitions are written down. Don't compare very different specialties as if they were identical units. The best use is following the same service line over time, with enough context and cases.
Four decisions the analysis can change
Redesign the cycle
When the extra time is concentrated in waiting, poor preparation, scattered information or unclear handoffs, the decision is to redesign the process. That can mean confirming ahead of time, preparing materials, assigning clear ownership, keeping documentation easy to find and syncing better with the lab.
Review fees, costs or terms
When the margin drops because of materials, lab fees, card fees, splits, discounts or taxes, review the cost structure and your policies with your accountant. The fix may be in the fee, in supplier negotiations, in how the service is designed or in payment terms. Don't assume raising the fee is always possible or enough.
Protect scarce capacity
When a service line uses a scarce resource, such as a specialist's time, a piece of equipment or a specially prepared room, the decision should weigh demand, contribution, access, continuity and risk. Priority can't be set by the highest fee alone.
Don't rush what needs time
Kaplan and Porter warn that cutting clinicians' time across the board can hurt patient understanding, adherence and outcomes. Even though the studies they cite come from other areas of healthcare, the management lesson applies: productivity shouldn't reward clinical haste or squeeze the explanations patients need.
A 45-minute review routine
Start with five to ten completed cycles of a single treatment type. The small sample is on purpose: the first goal is to learn how the data connects and fix definitions before expanding the analysis.
- Rebuild the cycle: dates, visits, planned and actual hours, key resources and the reason for any variation.
- Close the economics: net revenue, variable costs, splits, fees and when payments came in.
- Separate necessary from avoidable variation. A planned clinical visit isn't rework just because it takes time.
- Pick one balancing measure, such as delays, team workload, documentation continuity or patient feedback.
- Write down one hypothesis, the data behind it, the change to test, the owner and the review date.
The IHI recommends looking at data over time and testing changes in small cycles. For a clinic, that keeps one unusual case from becoming permanent policy and helps you tell real improvement from normal ups and downs.
Where HartSystem fits in
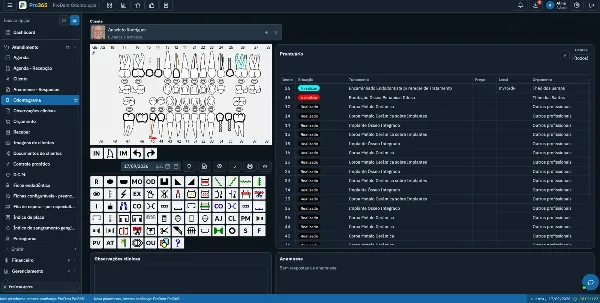
ProDent brings together scheduling, treatment plans, production by provider and specialty, collections, payables, commissions, overdue balances and management indicators. The value shows up when the manager combines a period, a comparison, context and an action. The quality of any dashboard also depends on how consistently the team records information.
That foundation shortens the distance between what was planned on the schedule, what was done, what was produced and what was collected. The Pro365 AI Consultant can help answer questions about your recorded data, while the Instructor helps the team use the system. Personalized consulting and hands-on support can help with setup, training, cleaning up records and building the analysis into your routine.
A productive conversation with HartSystem's consulting team starts with a real cycle and a focused question. For example: why does this service line use more hours than planned, and at what point do the schedule, production, costs and collections stop telling the same story? Organized information doesn't replace judgment, but it greatly improves the quality of the question.
Productivity means turning chair time into sustainable value
Dental chair productivity isn't about finding the treatment that earns the most per minute. It's about explaining how a cycle turns clinical capacity into sustainable value, without confusing production with cash, margin with profit or speed with quality.
The first step is to pick one treatment type, rebuild a few complete cycles and compare what was planned with what happened. When the clinic sees time, resources, contribution, collections and balancing measures in the same conversation, decisions about fees, process, scheduling and growth stop depending on isolated impressions.
With Pro365 GO, the new ProDent that runs 100% on the web, your schedule, treatment plans, production and collections live in one place, so the full cycle is easier to rebuild. Book a demo to see it with your own workflow.