Periodontal charting software creates value in stages, not the day it's installed. Having a perio chart in the system is different from having a mature digital periodontal routine, so the useful question is which maturity level your clinic is at today and which next step will bring more clarity, speed and continuity.
A clinic can record plenty of information and still lose time checking fields, looking for the previous exam, explaining the case without a consistent visual reference or fixing differences in how each provider fills in the chart.
Periodontal charting software starts to pay off when the record stops being just a completed screen and starts supporting a process. The exam needs to bring related parameters together, carry a clear date, allow comparison and stay available in the patient record for authorized users. The team also needs to know how to fill in, review and retrieve this information without building parallel controls.
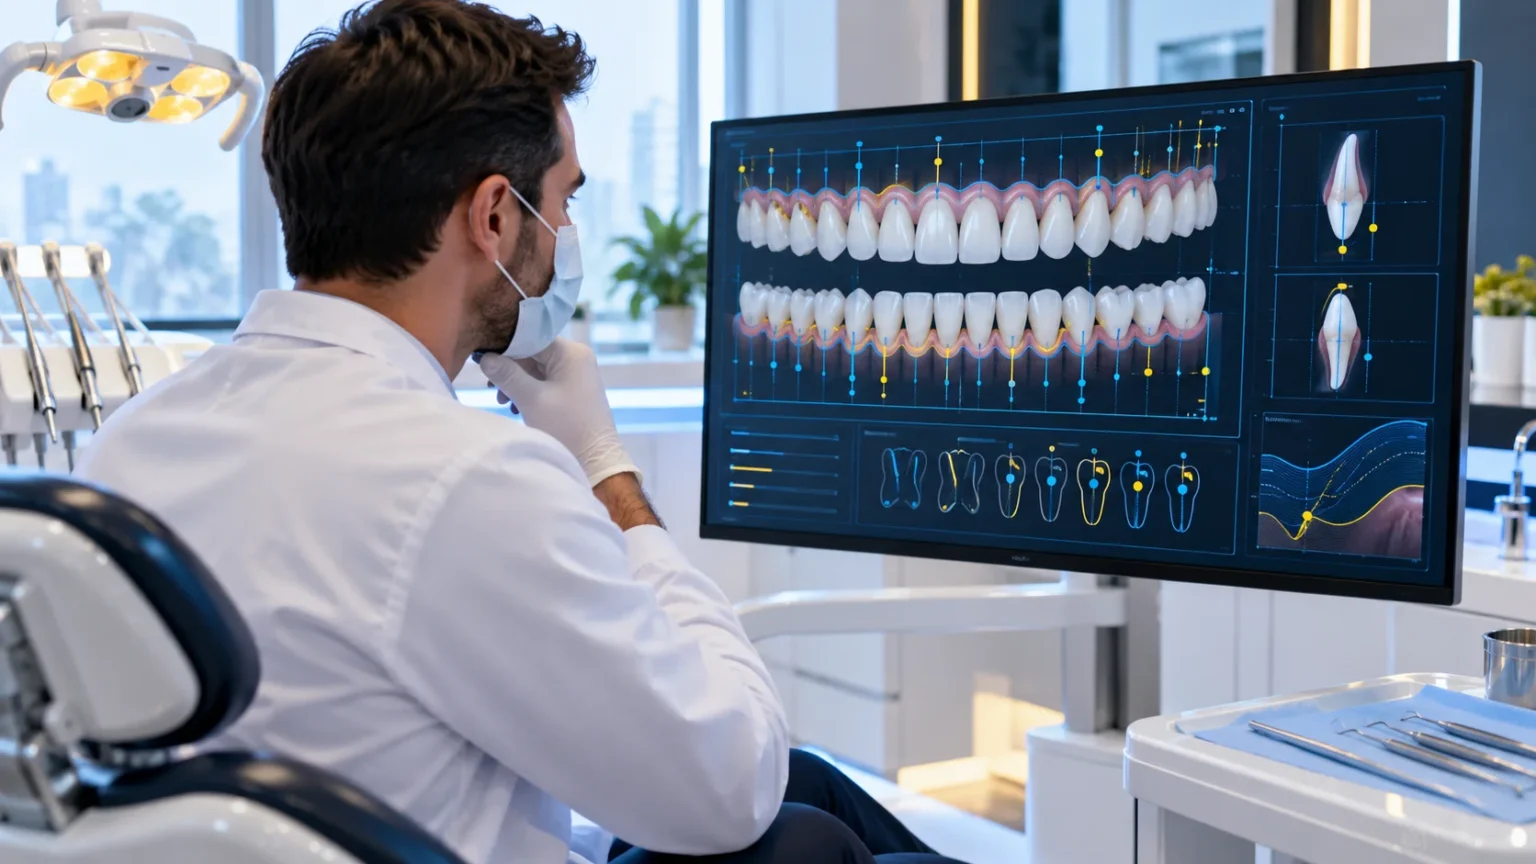
In ProDent, the Periodontal Chart records the periodontal exam visually, tooth by tooth. Its fields include probing depth, clinical attachment, bleeding, tooth mobility, furcation, plaque, occlusal trauma and bone loss classified as type 1, 2 or 3. Each record is tied to a date, and graph lines can support comparisons between different periods.
The four maturity levels of a digital perio chart
Level 1: the exam is off paper
At the first level, the main achievement is centralizing the record. The perio chart no longer depends on loose sheets, disconnected files or notes that are hard to find. The clinic finds the exam in one digital place and spends less time hunting for the right version.
This step matters, but it's only the start. Going digital doesn't automatically fix incomplete fields, different charting criteria or missing context. If every provider records things differently and no one checks the exam for consistency, the screen changes but the rework stays.
Sign you're at this level: the perio chart is used, but the main perceived value is still "we don't use paper anymore."
Recommended next step: define who charts, at what point in the visit, which fields need to be reviewed and where usage questions go.
Level 2: the parameters form a complete map
At the second level, the clinic starts treating the exam as a whole. Probing depth, clinical attachment, bleeding, mobility, furcation, plaque, occlusal trauma and bone loss stop being separate fields and become a periodontal map that can be read in the context of the visit.
Efficiency shows up because the provider doesn't have to rebuild their reasoning from scattered notes. The tooth-by-tooth record puts related information in a single view. That also makes review more objective, because gaps and inconsistencies are easier to spot before the visit ends.
A simple internal rule helps. When the exam is finished, the clinic checks that the date is right, the relevant parameters were recorded, important observations are in the patient record and another authorized provider could understand the result without a verbal explanation.
Sign you're at this level: the exam is centralized and complete, but comparing dates still takes effort or isn't part of a defined routine.
Recommended next step: choose a specific moment to open the previous record and compare what changed, always with the same clinical reference and the context needed.
Level 3: comparison becomes part of the visit
At the third level, the digital perio chart is no longer opened only when a question comes up. Comparison becomes part of the workflow. Dates keep the records in sequence, and graph lines can help visualize differences in attachment and gingival levels between periods.
Comparing doesn't mean automatically concluding that things improved or got worse. Exam technique, visit conditions, protocol consistency and professional interpretation are still essential. The operational gain is putting records side by side with less searching and less retyping, so the dentist can focus on the clinical reading.
This level also improves communication with the patient. An organized view can help the provider show which areas are being monitored and why certain sites deserve attention. The tool supports the conversation, but diagnosis, guidance and treatment decisions remain the provider's responsibility.
Sign you're at this level: the team can pull up previous exams and the provider compares them regularly, but the process still depends on a few people who know the feature well.
Recommended next step: turn what those people know into a standard way of working that the team can learn, review and maintain.
Level 4: use is sustained by process, training and support
At the fourth level, the perio chart is part of the clinic's routine, not one person's habit. There are clear responsibilities, a known charting sequence, review criteria, access rules and a defined path for questions. New providers don't have to figure out the process on their own, and the clinic can correct drift before parallel controls creep back in.
This is where personal support and tailored consulting carry more weight. A clinic can understand what the exam is for and still need help finding a function, reading the graph comparison, reviewing the charting workflow or training the team. Support is most productive when it starts from a real situation and a clearly defined expected result.
Instead of asking for "training on everything," the clinic can bring a specific operational question. For example: how to standardize the charting sequence, how to pull up two dates for comparison or how to tie the record to the patient chart without duplicating notes. That precision shortens the distance between guidance and daily use.
Sign you're at this level: the feature stays useful even when a provider leaves, the routine changes or the team needs a refresher, because the knowledge isn't concentrated in one person.
Recommended next step: review adoption periodically, find where rework still happens and use support or consulting to remove one obstacle at a time.
Which level is your clinic at today?
Maturity doesn't depend on how many screens are open or how many fields are filled in. It shows in the quality of the process. Use these questions to find where your clinic stands.
- Can authorized users find the perio chart quickly in the patient record?
- Does the team know which parameters to record and at what point in the visit?
- Do the records have enough date and context for a responsible comparison?
- Can the provider view two exams without copying data somewhere else?
- Does the patient get a clear explanation, without the chart being treated as an automatic diagnosis?
- Do usage questions lead to guidance that later becomes an internal standard?
- Can a new team member learn the workflow without relying only on a colleague's memory?
If the gaps are in the first two questions, the priority is centralization and completeness. If the trouble starts with comparison, focus on the workflow between exams. If everything works only when one experienced person is around, the next step is adoption backed by training, internal documentation and support.
Where operational efficiency shows up
The efficiency gain doesn't come from rushing the clinical exam. It comes when technology cuts administrative steps that add no value and better preserves the context the provider needs.
Less searching and less duplication
When the periodontal record is linked to the digital patient record, the team relies less on paper, outside files and messages used as memory. The exam is easier to find and there's less risk of keeping parallel versions.
More objective review
A tooth-by-tooth view helps check that the whole exam makes sense before the record is closed. The goal isn't to replace clinical judgment, but to spare the provider from reorganizing scattered information to understand what was documented.
Comparison with less retyping
Dates and graph lines let you look at different periods within the feature. The clinic spends less time copying measurements into spreadsheets or side summaries and more time reviewing the exam in the right context.
Clearer visual communication
Patients don't always understand a string of isolated measurements. A visual presentation can support the explanation of the areas being monitored and the changes observed. The provider is still responsible for explaining what the chart represents and for avoiding conclusions outside the full exam.
Continuity between authorized providers
When the information is complete and part of the patient record, another authorized provider can better understand where the follow-up stands. That reduces reliance on memory, hallway conversations and notes reconstructed after the visit.
What ProDent organizes and what stays a clinical decision
ProDent organizes the record, the visualization, the dates and the comparison available in the feature. That structure can support efficiency, documentation, communication and continuity. It doesn't replace the medical history, the periodontal exam, probing technique, diagnosis, interpretation, risk assessment, treatment plan or the dentist's decisions.
It's also up to the clinic to define permissions, responsibilities, a charting protocol and review criteria. Software can make the process more visible and accessible, but the quality of the data depends on how the team examines, records and uses the information.
This separation matters for responsible adoption. The clearer the line between technological organization and professional decision, the more useful the perio chart becomes as a working tool.
How HartSystem can help you reach the next level
ProDent brings together clinical tools such as the digital patient record, dental charting, clinical notes, specialty forms, images and documents. HartSystem also offers personal support and tailored consulting, which matter when a clinic wants to turn an available feature into a process used consistently.
For a productive conversation, pick one concrete difficulty. It might be an incomplete exam, a comparison the team doesn't know how to pull up, different habits between providers or a step that still happens outside the system. Describe what happens today, who's involved, where the workflow stalls and what result would count as good enough.
That focus lets the demo or the support session concentrate on what really matters for your routine. Instead of touring features without priorities, the clinic sees how the periodontal charting software answers an observable need.
From an available feature to a process the team can sustain
A digital perio chart shouldn't be measured by how much information fits on the screen. Its value lies in bringing related parameters together, keeping dates, supporting comparisons and keeping the record available in the patient chart for safe, organized use.
The four levels help you see the next step without trying to change everything at once. First, centralize. Then, complete. Next, compare. Finally, sustain the routine with responsibilities, training and support. Each step removes a different kind of rework and brings the technology closer to clinical practice.
To evaluate ProDent objectively, pick a fictional or properly de-identified periodontal case, describe how your team works today and ask for a demo focused on your next maturity level. With Pro365 GO, the new ProDent that runs 100% on the web, the Periodontal Chart lives inside the patient record your whole team already uses. Book a demo to see it with your own workflow.