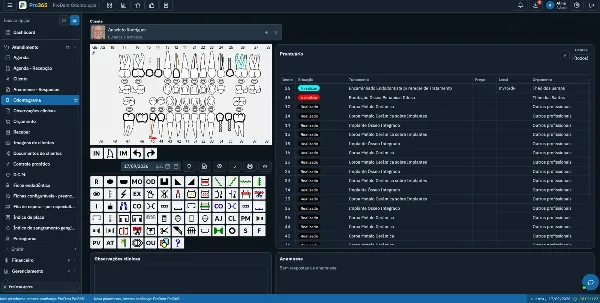
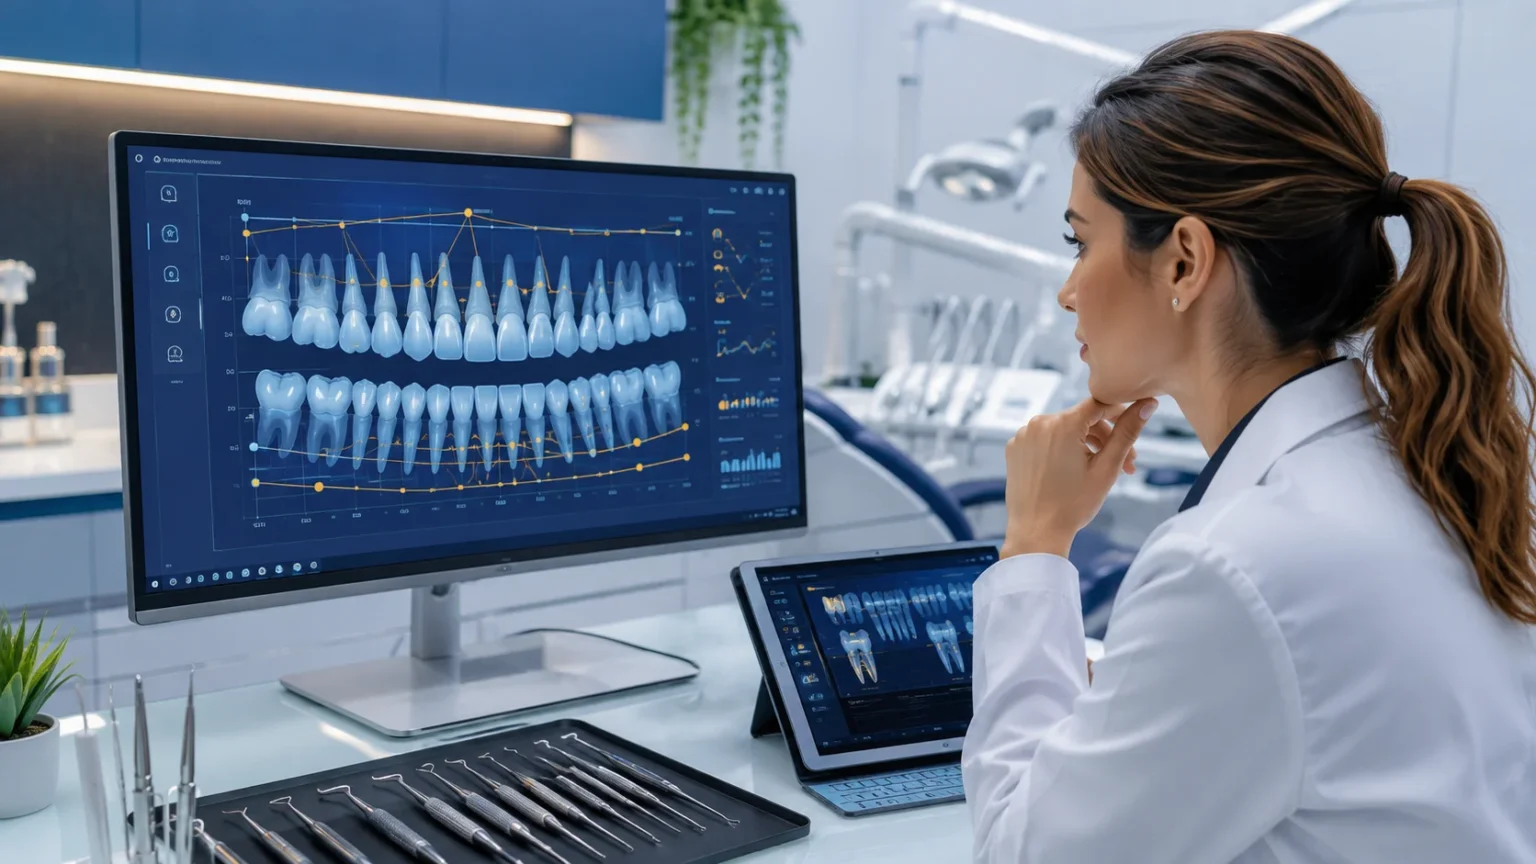
Periodontal charting is most useful when each exam is compared with the previous one, not read as a standalone form. In ProDent, the perio chart records findings tooth by tooth, links them to a date and lets you compare exams with graph lines. That way you can see what changed between visits and plan the next step of follow-up.
Two perio charts can hold dozens of measurements and still offer little clarity. That happens when each exam is treated as a separate form, with no rule for comparison, no clinical context and no defined next step.
The value appears when the dentist can rebuild the history of the case: where probing depths concentrate, which sites bleed, where there's mobility or furcation involvement, what has changed since the last evaluation and which points need attention during follow-up.
ProDent's Periodontal Chart brings together a tooth-by-tooth visual record and lets you document probing depth, attachment level, bleeding, tooth mobility, furcation, plaque, occlusal trauma and bone loss classification in types 1, 2 and 3. The data is linked to a date and can be compared using the feature's graph lines.
That structure reduces reliance on loose notes and makes continuity between visits easier. It also helps the dentist explain the situation to the patient with visual support, as long as the reading always happens within the full clinical exam.
Four layers for reading the chart
To use a digital periodontal chart in practice, it helps to split the reading into four layers. Each one answers a different question and keeps a single number from turning into a hasty conclusion.
Layer 1: a reliable record
The first layer is data quality. Before comparing results, the clinic needs consistency in how it examines and records. Probing technique, the instrument used, site location, tissue condition and the clinical moment can all influence the measurement.
The American Academy of Periodontology notes that probing force, angulation, location, anatomy and gingival conditions are among the factors that influence probing measurements.
In ProDent's Periodontal Chart, the tooth-by-tooth record gives the clinical team a shared structure. Efficiency doesn't come from clicking faster. It comes from closing gaps, keeping the same logic from visit to visit and saving the information to the patient record with the correct date.
Layer 2: how findings are distributed
After recording, the dentist needs to see where findings concentrate. An overall average can hide localized areas. So the visual reading should consider the distribution of probing depths, bleeding points, attachment changes, mobility and teeth with furcation involvement.
This layer turns the perio chart into a map. Instead of asking only for a total value, the dentist asks which regions show recurrence, which teeth deserve careful reevaluation and which findings need to be related to images, clinical notes and the patient's history.
Layer 3: change between dates
The third layer is about time. ProDent's Periodontal Chart lets you compare records from different dates and use graph lines to see changes related to attachment and the gingiva. The comparison is worth more when exam conditions are documented and when the dentist looks site by site, not just at the overall shape of the graph.
A visual change can signal improvement, stability, worsening or the need to double-check the record. The software organizes the evidence and makes comparison easier, but it doesn't replace professional interpretation. When something doesn't add up, the safe path is to review the context, the technique, the other findings and the history recorded in the patient chart.
Layer 4: decision and communication
The last layer connects the exam to continuity of care. The record needs to support a coherent decision, such as reinforcing home care instructions, rechecking a site, scheduling a new evaluation, relating the finding to other exams or updating periodontal follow-up according to the dentist's judgment.
The visual chart can also make the conversation with the patient easier. Instead of presenting an abstract string of numbers, the dentist can show where the findings are and how they changed over time. The explanation should be clear, without turning the graph into a promise of results or an automatic diagnosis.
From a marked site to the next visit
A simple routine helps the team turn periodontal charting into a process. The goal isn't more paperwork. It's making sure the exam produces enough context for the next appointment.
1. Check the context before the exam
Open the patient's history and review previous records, images, complaints, relevant factors the patient reported and the date of the last perio chart. That keeps the current evaluation from being treated as a first look at the case.
2. Record in a set sequence
Follow a consistent clinical order to reduce omissions. Enter the data in ProDent's Periodontal Chart according to the exam performed and confirm that teeth, surfaces and fields match what was observed.
3. Review the map before closing
Do a final read of the distribution. Look for unlikely values, missing fields and differences that deserve confirmation. This quick review makes the history more reliable and reduces rework later.
4. Compare with the right date
Choose the previous exam that truly works as a reference. Compare the graph lines, the sites and the related findings, keeping in mind that intervals, clinical conditions and consistent technique are part of the interpretation.
5. Write a summary in the patient record
The perio chart shows detailed data, but continuity also depends on a clear clinical summary. Record the professional reading, the guidance given, the treatment decision and the next follow-up point according to the clinic's rules.
6. Prepare the conversation with the patient
Use the visual chart to explain what was observed, what changed and why follow-up matters. Plain language and context help the patient take a more active part in their care.
Where operational efficiency shows up
The operational gain of a digital periodontal chart isn't just replacing a paper form. It shows up when the record connects to the patient chart and reduces fragmented work.
- Continuity between providers: an authorized dentist can understand what was measured, when it was measured and which notes came with the exam, without relying on the memory of whoever saw the patient before.
- Less searching for information: periodontal records, notes and the rest of the patient history sit closer together in the clinical routine.
- More objective comparison: dates and graphs help locate changes and frame more precise clinical questions at reevaluation.
- More visual communication: patients can better understand where findings are when the dentist walks them through the map in simple terms.
- More consistent training: the team can learn a shared sequence for recording, reviewing and summarizing.
Five mistakes that reduce the value of a perio chart
Filling it in without reviewing
One swapped field or omission can distort future comparisons. Checking the chart should be part of closing the exam.
Looking only at the highest number
The distribution of findings, bleeding, attachment, mobility, furcation and clinical context all help build a more complete reading.
Comparing exams without considering context
Differences in technique, clinical moment and record quality need to be considered before interpreting a change.
Leaving the graph without a clinical summary
A detailed map doesn't remove the need to record the professional interpretation and the treatment decision in the patient record.
Training only the clicks
Knowing how to open and fill in the screen is different from having a protocol. The team needs to agree on purpose, sequence, review, responsibilities and access criteria.
An important limit: ProDent's Periodontal Chart organizes measurements, history and visual comparison. It doesn't replace the periodontal exam, the diagnosis, clinical interpretation or the treatment decisions made by the dentist.
When to bring in HartSystem's support team
Support is especially useful when the clinic wants to standardize first use, review the charting sequence, understand the graph comparison or train new providers. Bringing a concrete situation makes the session more productive: for example, a record the team can't find, a question about the workflow or a difference between two exams that needs to be checked in the system.
HartSystem's human support and personalized consulting help bring the tool closer to the clinic's real routine. The point is to turn guidance into an internal standard, so the know-how doesn't stay with just one person on the team.
A history that truly follows the patient
Periodontal charting is most useful when it works as a line of continuity. The first exam sets a baseline, the following records show changes and reading them together helps the dentist organize follow-up, patient communication and clinical documentation.
With ProDent's Periodontal Chart, probing depth, attachment level, bleeding, mobility, furcation, plaque, occlusal trauma and bone loss classification can be recorded in a tooth-by-tooth view, linked to dates and compared with graphs. That reduces scattered information and supports a more organized clinical routine.
With Pro365 GO, the new ProDent that runs 100% on the web, every perio chart stays in the patient record, ready to compare at the next visit. Book a demo to see periodontal charting in action.